The Problem
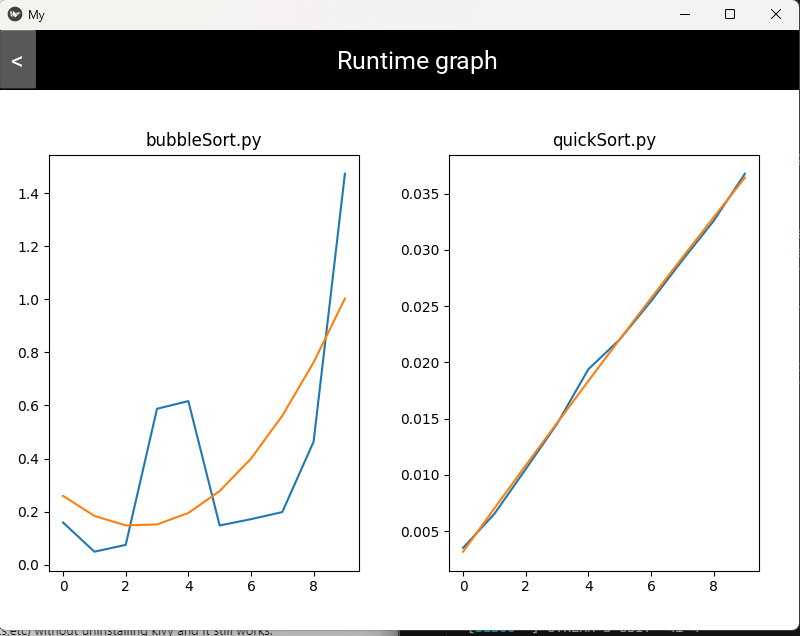
When studying algorithm complexity, textbooks give you Big-O notation but rarely show you the actual performance difference in practice. A theoretically O(n log n) algorithm can still run slower than an O(n²) one on small inputs due to constant factors. Understanding when complexity curves actually diverge — and by how much — requires empirical measurement, not just theory.
I wanted a tool that could take multiple sorting algorithm implementations, run them against the same inputs at increasing sizes, and plot the results so the performance difference becomes visually obvious.
What It Does
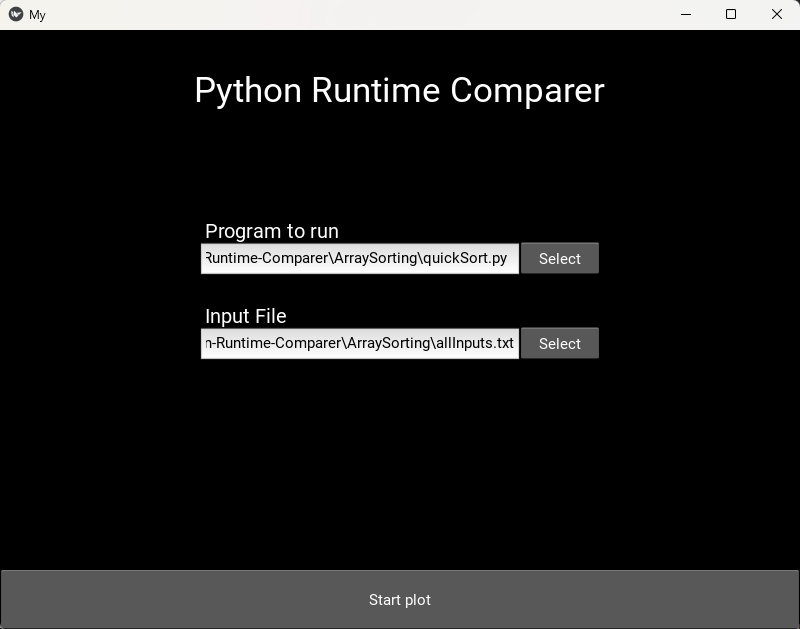
Python Runtime Comparer is a desktop GUI application built with Kivy that lets you select multiple solver files, input files, and output files, then automatically benchmarks them across varying input sizes. It graphs execution time against input size using matplotlib, making it easy to see where one algorithm overtakes another.
Beyond raw timing, it runs statistical analysis over the results to automatically identify which test cases consistently trigger worst-case or best-case behaviour for each algorithm. This turns abstract complexity analysis into something you can observe directly.
Features:
- Compares the runtime of different programs across identical inputs and outputs
- Graphs runtime over different input sizes using matplotlib
- Identifies test cases that consistently trigger worst-case or best-case behavior through statistics
- GUI-based file selection for solver, input, and output files via Kivy
Key Technical Decisions
I chose Kivy for the GUI because it's cross-platform and pure Python, which meant the entire tool — from file selection to graph rendering — lived in a single language without needing a web framework or separate frontend. Matplotlib handled visualization natively, fitting cleanly into the Python ecosystem.
The measurement approach runs each solver as a separate process with timing wrappers rather than importing and calling functions directly. This avoids Python interpreter startup time contaminating results and ensures each run gets a clean state, producing more consistent benchmarks.
What I Learned
This was one of the first tools I built to solve something I genuinely cared about. The experience reinforced that real motivation leads to better accuracy — I pushed to make the measurements reliable because I actually planned to use the results for studying.
It also gave me a much stronger intuition for how constant factors and cache behaviour can make theoretical complexity misleading at real-world input sizes, which informed how I think about performance-sensitive code ever since.